Members and subscribers alike know that I am forever on their case about having everyone – board members, staff, volunteers – together on the same page. Take this post from the summer of 2014, “When Board Members Say ‘I’ll Do Anything But Fundraise’ | 4 Tips” for instance. In that post, I shared four ways that you can begin to develop a culture of philanthropy amongst your board. The post was well received and I remember getting emails from readers who used some of my suggestions to great effect.

Now, you may be asking yourself, “Pamela, that blog post is three years old, why are you bringing it up again today?” Great fundraising never gets old and I see the same challenges time and time again. But over the past few months, I’ve been exposed to a new tactic and tool to share information with your board. I’ve seen (and heard from!) organizations (small shops in particular) who are leveraging this tool to help engage and inform their board. The results have been so impressive that I’m finally ready today to share some with you!
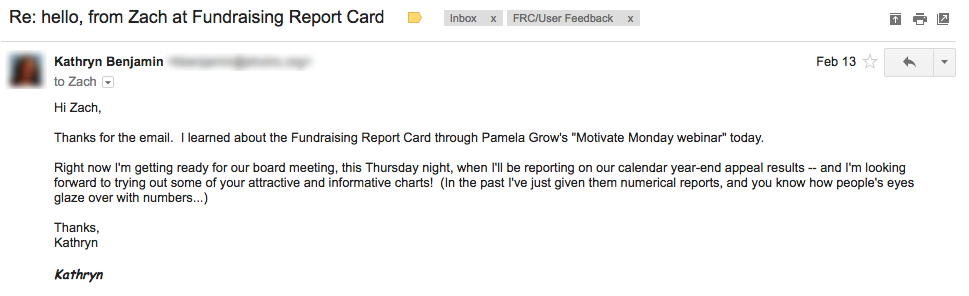
Kathryn Benjamin, the Development Director at the Somerville Homeless Coalition is a longtime blog subscriber and reader, and she was one of the first people to try out this new tactic. Back in February, we had Zach Shefska from Fundraising Report Card on as a guest for our Motivate Monday segment (view it by clicking here by scrolling down to February 13) . Zach shared his free donor analytics tool and offered to help any Motivate Monday listener to get setup and started that day. Kathryn took him up on it, and the timing couldn’t have been better.
With just a few days to spare before her upcoming board meeting, Kathryn thought she may have struck gold.
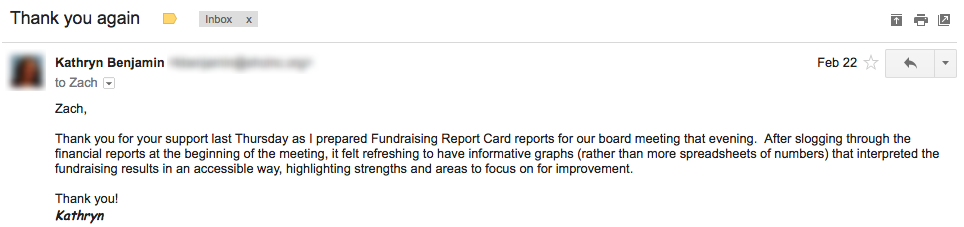
Instead of presenting spreadsheets and tables filled with data, Kathryn had an opportunity to create compelling, attractive and informative charts to share with her board. This might seem like a small difference, but the effect is powerful. It’s important to know that not everyone is a “data” person (truth be told, actually most people aren’t). But that doesn’t make reporting to your board any less important, it simply means you need different, more effective ways to share information with them. That’s where Kathryn’s use of Fundraising Report Card became so powerful!
If you’re experiencing board meetings where members are disinterested in fundraising performance or fundraising updates then that may be a sign to try something new during your next presentation. A board that only cares about programs isn’t healthy for the organization, but if board members aren’t focusing on fundraising initiatives it might be because they struggle to interpret all the moving pieces involved behind the scenes. Visual reports are a great way to spice up your board meeting and add a bit of flair. Flair that effectively highlights your department’s strengths and also helps identify weaknesses or areas of improvement.
As you can see from Kathryn’s experience, using Fundraising Report Card, and sharing visual reports was a huge success. Believe it or not, but board members don’t like looking at numbers and spreadsheets as much as you don’t like looking at numbers and spreadsheets. This is a great opportunity to spice it up. Plus, tools like Fundraising Report Card are FREE and Zach is sure to help you get exactly what you need out of the software. At a minimum, it’s at least worth a try.
To tie things together here, let’s pair this new tool/tactic with three actionable tips you can take to your next board meeting.
- Make sure your reports align with your overarching fundraising goals — your fundraising plan.
- Your reports and data are meant to tell a story, be sure to know the plot before presenting to the board so that you can help guide them as you share.
- Focus on one or two key reports at a time, don’t overwhelm anyone.


 I can’t wait to meet with you personally.
Comments on this entry are closed.